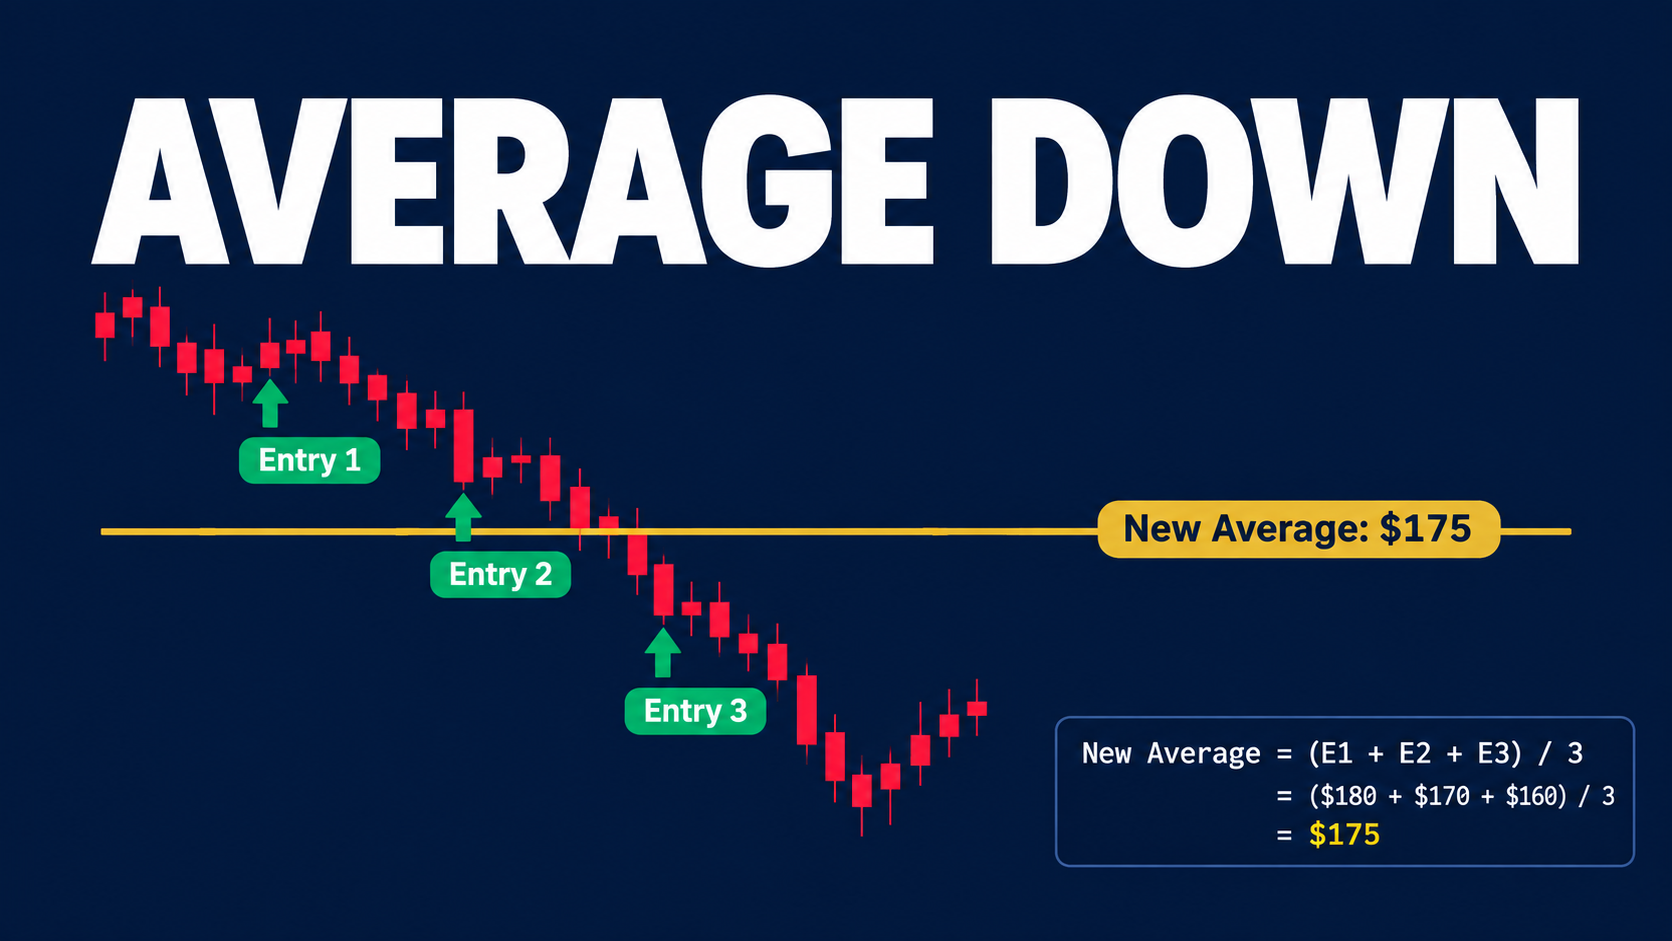
The Average Down Formula and How It Works
Average Down Entry = (Total Capital Deployed) ÷ (Total Units Held). For multiple purchase tranches: New Average = Σ(Shares_i × Price_i) ÷ Σ(Shares_i). This extends to any number of add-on positions — simply include each tranche in the sum. The result is your weighted average cost basis: the price at which your entire position reaches zero net P&L.
Three-tranche AAPL example: Tranche 1 — 100 shares at $190 (cost $19,000). Price falls to $175. Tranche 2 — 100 shares at $175 (cost $17,500). Price falls further to $160. Tranche 3 — 100 shares at $160 (cost $16,000). Total: 300 shares, $52,500 invested. Average entry = $52,500 ÷ 300 = $175.00. The stock must recover from $160 to $175 — a $15 (9.4%) move — just to break even. From the original entry of $190, the recovery is 18.75%, but averaging down reduced the break-even requirement on the combined position.
The ratio of add-on size to original position is the key variable that determines how much the average moves. Adding 25% of original size at a 10% discount moves the average by only 2%. Adding 100% (doubling) at a 10% discount moves it by 5%. Adding 200% (tripling total) at a 20% discount moves it by 13%. The more aggressive the averaging, the more the average moves — but also the more capital is at risk if price continues falling. Use the average down calculator to model any scenario before committing capital.
The 5-Rule Checklist Before You Average Down
Rule 1 — Was this add planned before the first entry? If you are deciding to average down while watching a losing position on your screen, the answer is almost certainly no. Unplanned adds are reactive, not strategic. Every tranche of an averaging plan should be defined before the first order is placed: the price trigger, the size, and the maximum total exposure across all tranches.
Rule 2 — Is the original trade thesis still intact? If you bought a stock because earnings growth was accelerating and a earnings miss has caused the drop, your thesis is broken. If you bought EUR/USD because the ECB was hawkish and the ECB has now cut rates, your thesis is broken. Only average down when the reason the position is losing is temporary noise, not a fundamental change to the reason you entered.
Rule 3 — Does the combined position risk stay within your original risk budget? Calculate the total dollar loss if the combined position (original + add-on) hits your stop loss. If this exceeds your 1–2% risk budget, you are increasing risk beyond your plan. Averaging down should never expand your risk budget — it only redistributes it across a lower average entry. If the combined stop-out loss exceeds your limit, reduce the add-on size until it fits.
Rule 4 — Can you afford to be wrong on the add-on too? If the position continues falling after you average down, you will have more capital at risk at a worse level. Before adding, ask: if this additional tranche also loses and hits the stop, can I absorb that loss without changing my behavior on future trades? If the answer is no, do not add.
Rule 5 — Are you averaging down on an asset that can go to zero? Penny stocks, highly leveraged products, individual crypto tokens with no utility, and companies with serious solvency concerns can all fall to zero. Averaging down on any asset that carries a realistic risk of complete loss is a strategy with infinite downside and no theoretical floor. Only average down on assets where intrinsic value or fundamental demand creates a rational recovery basis.
Skip the manual math
Calculate your new average entry price and break-even instantly for any add-on trade.
Open Average Down Calculator →The Psychology That Makes Averaging Down Dangerous
Three cognitive biases combine to make averaging down feel rational when it is not. The first is loss aversion: the psychological pain of realizing a loss is roughly twice as powerful as the pleasure of an equivalent gain. This makes traders avoid closing losing positions and instead add to them — not because it makes analytical sense, but because adding feels like "doing something" rather than accepting the loss.
The second is confirmation bias: once you have committed capital to a position, you unconsciously filter information to support staying in (and adding to) it. Bullish news gets amplified; bearish signals get rationalized away. When you are averaging down, your brain is actively working against your ability to evaluate the position objectively. This is why pre-trade plans — written before any capital is at risk — are the only reliable protection against confirmation bias in trade management.
The third is sunk cost fallacy: the belief that because you have already lost money on a position, you are now "owed" a recovery, and adding to the position increases your claim on that recovery. In reality, markets have no memory of what you paid. The $1,000 you have already lost on a position is irrelevant to whether the asset will rise or fall from the current price. Every decision to add capital must be evaluated purely on the forward-looking case — as if you were considering a new position from scratch at the current price with no prior history.
When Averaging Down Helps vs. When It Destroys Accounts
Appropriate use cases: (1) Dollar-cost averaging into broad index ETFs (S&P 500, total market) on a pre-defined monthly schedule — you are investing for 10+ years and drawdowns are temporary by historical standard. (2) Adding to a fundamentally sound stock after an earnings overreaction — the business is intact but institutional selling created a temporary discount. (3) Scaling into a planned forex position in two tranches before the stop is reached, with combined risk pre-calculated to fit your risk budget. (4) Systematically adding to a quality dividend stock during a broad market correction, not a sector-specific collapse.
Dangerous patterns — stop before you add if any of these apply: You are adding because the position has hit your original stop loss and you moved it instead of closing. You are adding because you "feel" a reversal is near with no supporting technical or fundamental evidence. The company or asset has released news that changes the original investment thesis (missed earnings, regulatory action, CEO departure, protocol exploit). You are averaging down on a highly leveraged CFD, future, or option that approaches expiry or liquidation. You are using money you cannot afford to lose. Any single one of these conditions should be a hard stop — not a reason to add a larger tranche.
The clearest test: write down the specific reason you are adding, in a sentence, before placing the add-on order. Then read it back in 60 seconds. If it reads like an analytical reason ("adding at the 200-day MA support, thesis unchanged, total combined risk $200 on $20,000 account") rather than an emotional one ("I think it has to bounce from here"), proceed. If it reads emotional — do not add.
How Far Must Price Move to Profit After Averaging Down?
After averaging down, your new break-even is your average entry price. But break-even only recovers costs — it does not produce profit. The critical pre-add question is: given that the position is already losing, how far must price move from the current level to reach my new average, and then from the average to my profit target?
Worked example: Buy 100 shares at $60 (position now at $50, down $10, −16.7%). Average down with 100 more shares at $50. New average = $55. Current price = $50. Required move to break even from current price = $5 (+10%). If original profit target was $68, that is now $18 above the new average entry — price must move +36% from $50 to hit the same target. Compare: original plan required price to move from $60 to $68 (+13.3%). Averaging down tripled the required percentage move to profit. This is the hidden cost no calculator shows you automatically.
This math gets dramatically worse with each tranche. Add a third tranche at $40 (100 more shares): total = 300 shares, $17,000 invested, average = $56.67. Current price $40. Required move to average: +41.7%. Required move to original $68 target: +70%. The position now requires a near-doubling of price to produce the profit the original trade would have generated on a small bounce. Use the average down calculator to run this math explicitly before every add.
Averaging Down vs Averaging Up: Which Is the Better Strategy?
Averaging up means adding to a position that is already profitable — increasing size as the market confirms your original thesis. Averaging down means adding to a position that is already losing — increasing size while the market contradicts your thesis. From a trend-following and momentum perspective, averaging up is almost always the superior approach for active traders because you are adding capital in the direction the market is already moving.
The case for averaging up: your original entry was validated by subsequent price movement. Adding at a higher price raises your average cost, but it also means your existing position is already profitable and provides a buffer. If the position turns, you are giving back profit — not adding new losses on top of existing ones. Professional trend traders almost exclusively pyramid (scale) into winning positions, not losing ones.
The case for averaging down in investing: when you are buying broadly diversified assets with a 10+ year time horizon, lower prices genuinely represent better value. An S&P 500 index fund bought at a lower price will produce higher returns than the same fund bought at a peak, given enough time. This logic applies to long-term index investors — it does not apply to active traders with defined profit targets and time horizons measured in days or weeks.
The practical rule: if you are an active trader with stop losses and profit targets, average up into winning positions, not into losing ones. If you are a long-term passive investor in diversified assets, systematic averaging down through market corrections is rational and well-supported by historical data.
The Professional Scaling-In Strategy vs Emotional Averaging
There is a legitimate version of adding to positions that professional traders use: scaling into a planned position before the trade reaches its initial stop. Example: you want a 1-lot EUR/USD long with a 60-pip stop and a 120-pip target. Instead of entering the full 1 lot at once, you plan to enter 0.5 lots at a key resistance breakout and add the remaining 0.5 lots if price pulls back to a support level within the range. Both entry prices, sizes, and triggers are defined before the first order is placed, and the combined risk of both tranches is calculated to equal your 1% risk budget.
This planned scaling is fundamentally different from emotional averaging. The distinctions: (1) The add-on price is defined in advance, not chosen while watching a losing position in real time. (2) Total combined risk across all tranches is within your risk budget from before the first order. (3) The stop loss for the entire combined position is fixed — both tranches exit at the same stop. (4) The position is not already at a loss when the scaling plan was designed. All four criteria must hold. If even one fails, the scaling is reactive, not planned.
A simple way to check: did you write down the second entry price, size, and combined risk before you placed the first order? If yes, what you are doing is legitimate planned scaling. If no — if you are choosing the add-on price while looking at a red position — you are emotionally averaging, regardless of how rational it feels in the moment.
When You Should Never Average Down: Assets and Scenarios to Avoid
Never average down on assets with no fundamental floor. Penny stocks (under $5), speculative micro-cap stocks with no revenue, highly leveraged ETFs (3× inverse ETFs), individual small-cap crypto tokens, and companies with solvency risk (high debt, negative cash flow, possible bankruptcy) all share a common feature: they can fall to zero and never recover. There is no intrinsic value to anchor a recovery thesis. Averaging down on any of these assets is adding capital to a position that may permanently go to zero.
Never average down when you have moved your stop loss. If your original stop loss has been hit and you chose not to take the loss — instead moving the stop lower — you have already violated your risk plan once. Adding more capital at this point compounds the violation. A moved stop is a sign that emotional decision-making has already taken over. The correct action when a stop is hit is to close the position, take the loss, and start fresh with a new unbiased analysis.
Never average down in leveraged accounts near a margin threshold. In CFD, forex, and futures accounts, averaging down increases your margin requirement at the same time as your equity is declining. This compresses your margin level on both sides simultaneously — falling equity and rising margin requirement — and can result in a broker-forced liquidation of your entire position at the worst possible price. Run the margin calculation explicitly: if the combined position requires more than 50% of your available equity as margin, the risk of margin call is severe enough to disqualify the add.
Averaging Down in Forex vs Stocks vs Crypto: Key Differences
In stocks, averaging down has the strongest rational basis when applied to fundamentally sound, profitable companies — particularly large-cap blue-chip stocks with decades of dividend history and strong balance sheets. These stocks have an intrinsic value floor that provides a logical basis for expecting eventual recovery. The strategy has no rational basis for speculative growth stocks with no earnings, companies facing legal or regulatory risk, or any business where going concern is in question.
In forex, currency pairs reflect macro forces — interest rate differentials, central bank policy, trade balances, geopolitical risk — that can trend in one direction for 6 to 18 months during major economic cycles. Averaging down against a trending currency pair is fighting a macro force with a retail-size account. The only contexts where averaging down in forex has any defensible basis are mean-reverting short-term setups (range-bound pairs at well-established support) with a fixed combined stop that applies to the full position.
In crypto, extreme volatility makes averaging down particularly hazardous. Assets can decline 70–90% from cycle peaks during bear markets, and an initial 20% decline that triggers an average-down add can itself be followed by another 60–70% fall. Bitcoin and Ethereum, as the most established crypto assets, have historical precedent for recovering from severe drawdowns over multi-year periods. Smaller altcoins may never recover. The only version of crypto averaging down with any rational basis is systematic DCA into the two or three most established assets over a multi-year time horizon — never adding to a short-term speculative position.
How to Average Down Guide — Step by Step
- 1
Record your initial position
Note your original entry price and the number of shares, lots, or coins you already hold. This is Tranche 1 in the calculation.
- 2
Define the add-on price and size
Decide how many additional units you will add and at what price. Keep total combined risk within your pre-set risk budget for this position.
- 3
Calculate total cost across all tranches
Total Cost = Σ(Units_i × Price_i) for every tranche. Example: 100 shares at $60 + 100 shares at $50 = $6,000 + $5,000 = $11,000 total cost.
- 4
Calculate new average entry
New Average Entry = Total Cost ÷ Total Units. $11,000 ÷ 200 shares = $55.00 new average. This is your new break-even before commissions.
- 5
Run the recovery math before adding
Calculate how far price must move from the current level to reach your new average, then to your profit target. If the required recovery exceeds your original expectation by more than 2×, reconsider the add.
Frequently Asked Questions
Q.What does averaging down mean?
Averaging down means buying additional units of an asset at a lower price than your initial entry after a position has moved against you. This reduces your weighted average cost basis — the price at which your combined position reaches zero P&L. It does not reduce your total dollar loss at any given price; it only changes the price level at which you break even.
Q.What is the formula for calculating average entry after averaging down?
New Average Entry = (Shares₁ × Price₁ + Shares₂ × Price₂) ÷ (Shares₁ + Shares₂). For three tranches: (Shares₁ × Price₁ + Shares₂ × Price₂ + Shares₃ × Price₃) ÷ (Shares₁ + Shares₂ + Shares₃). Example: 100 shares at $60, 100 at $50, 200 at $40 = ($6,000 + $5,000 + $8,000) ÷ 400 = $19,000 ÷ 400 = $47.50 average entry.
Q.Is averaging down a good or bad strategy?
It depends entirely on context. Averaging down on quality assets with a pre-planned dollar-cost averaging schedule (e.g., buying index ETFs monthly regardless of price) is sound long-term investing. Averaging down in active trading — adding to a losing position in a trending market without a pre-defined plan — is one of the most dangerous behaviors a trader can exhibit. It converts small losses into catastrophic ones when the asset continues falling.
Q.How much does averaging down lower my break-even?
The reduction depends on the size ratio and price discount of the add-on. Adding an equal second position at 10% below original reduces average entry by 5%. Doubling at 20% below reduces it by ~13%. Quadrupling at 30% below reduces it by ~24%. The average moves more when you add larger positions at steeper discounts — but each add also multiplies your total exposure to further downside by the same factor.
Q.Is averaging down the same as dollar-cost averaging (DCA)?
They use the same math but differ in intent and structure. DCA is a pre-planned schedule of regular purchases regardless of price — used for long-term investing in assets you plan to hold indefinitely. Averaging down in trading refers to adding to a losing active trade position, usually in reaction to a loss. DCA with a plan and a long time horizon is sound investing. Averaging down without a plan in an active trade is reactive and dangerous.
Q.How many times should I average down on the same position?
Pre-define the maximum number of tranches before placing the first order. A two-tranche plan (initial + one add) is manageable. Three or more compounds risk exponentially — each successive add requires a larger capital commitment to meaningfully move the average, while the position is already deep in loss. Most professional risk managers cap averaging down at one add-on at most, and only when the combined risk remains within the original risk budget.
Q.Does averaging down work differently in forex than stocks?
Yes — significantly. Stocks have fundamental value anchors (earnings, book value) that provide a rational floor. Currency pairs reflect macro forces that can trend in one direction for 6–18 months with no mean-reversion. Averaging down against a strong forex trend is fighting a macro move with retail account size — a trade almost always lost. In crypto, 70–90% declines from peaks are common, making averaging down without tight stops on the combined position particularly hazardous.
Q.Is averaging down the same as the martingale strategy?
They share the same mechanical structure — adding to a losing position at lower prices — but differ in intent. Martingale specifically doubles position size at each loss level with the goal of recovering all losses on the next winning position. Averaging down typically uses pre-planned, fixed add-on sizes rather than doubling. Martingale is generally considered far more dangerous because the required capital grows exponentially, and a sustained drawdown can wipe out an entire account before a recovery.
Q.Can averaging down trigger a margin call?
Yes — and this is one of the most dangerous and overlooked risks. When you average down, you are increasing your total position size, which increases the margin required to hold it. If the position continues to fall after you have added, your equity drops while your margin requirement has increased. This compresses your margin level rapidly and can trigger a margin call or automatic stop-out at precisely the worst moment — when the position is deepest in loss and furthest from recovery.
Q.Should I average down on penny stocks?
Almost never. Penny stocks (typically stocks trading below $5, often on OTC markets) frequently decline because of fundamental deterioration, fraud, or promoter exit — not temporary market overreaction. Unlike blue-chip stocks, penny stocks can fall to near-zero and never recover. Averaging down on a stock in a structural decline amplifies losses with no rational basis for expecting recovery. The cases where averaging down is justifiable (strong fundamentals, temporary overreaction, pre-planned tranches) almost never apply to penny stocks.
Q.Is averaging up better than averaging down?
For active traders, averaging up — adding to a winning position as it confirms your direction — is generally considered superior to averaging down. When you average up, the market is validating your original thesis. When you average down, the market is contradicting it. Averaging up increases position size while momentum is in your favor; averaging down increases size while momentum is against you. Long-term index investors are the main exception: averaging down through market dips on diversified ETFs is rational when the time horizon is 10+ years.
Ready to calculate?
Calculate your new average entry price and break-even instantly for any add-on trade.
Open Average Down Calculator →
Written by
Foysal MostafaForex trader and software developer. Built TradeCalc to replace the manual spreadsheets I used for position sizing and risk management in my own trading.