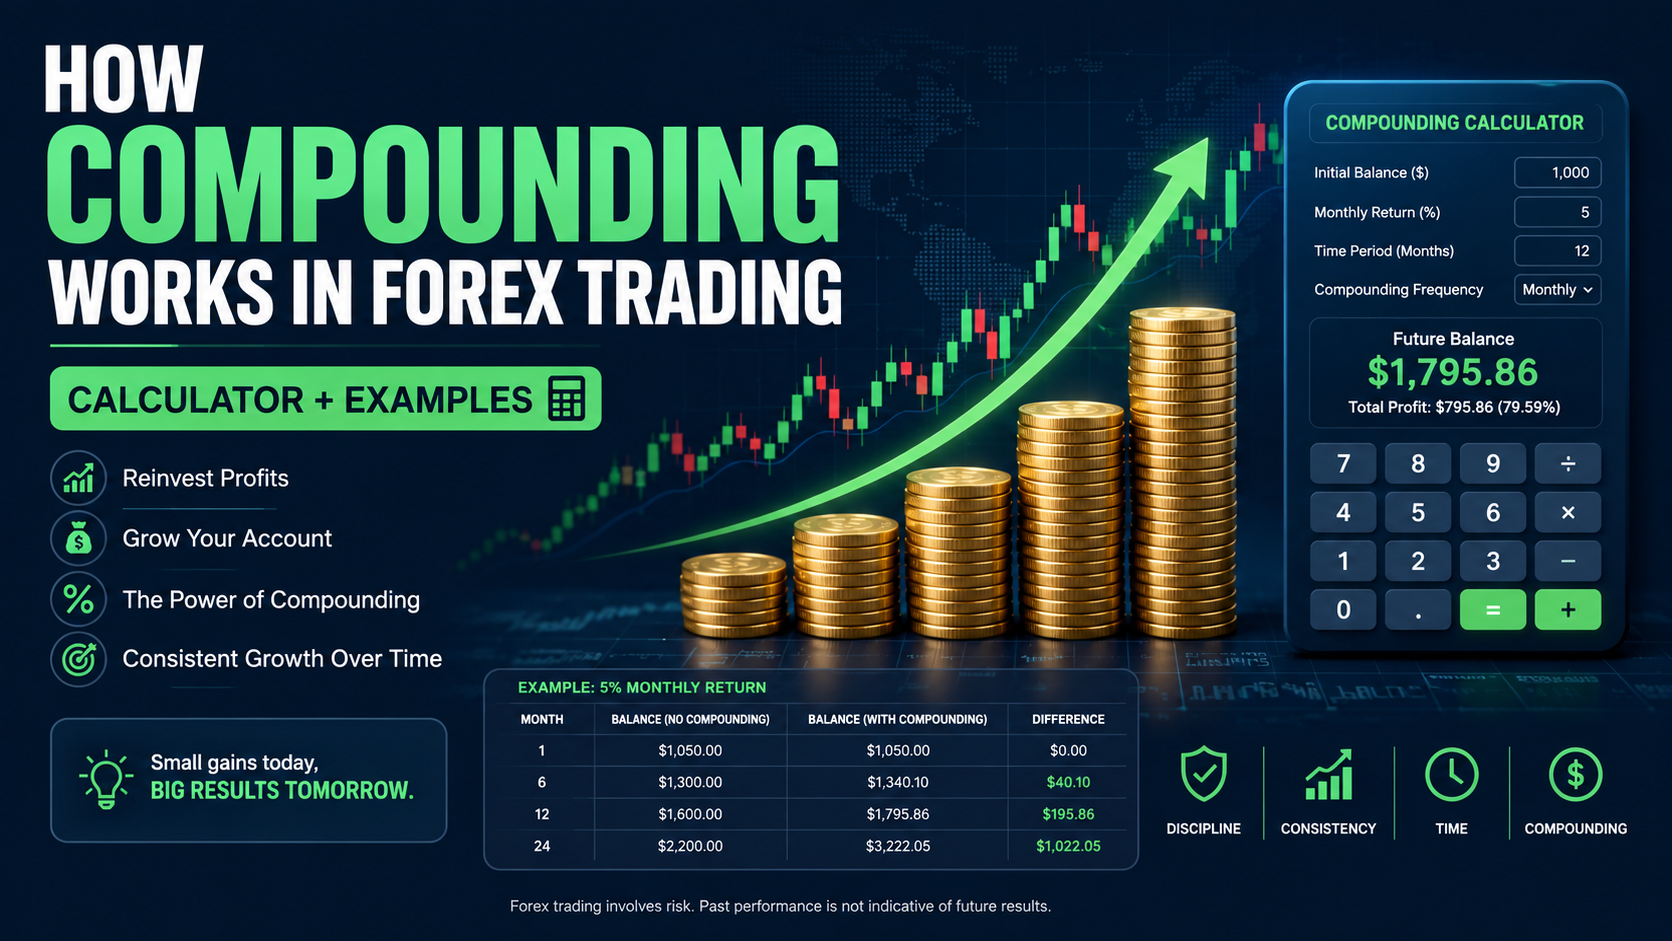
What Is Forex Compounding?
Forex compounding is the process of reinvesting trading profits back into your account so that each subsequent trade is sized off a larger balance. Instead of withdrawing gains or keeping your lot size fixed, you recalculate your position size based on the growing account balance. The result is exponential — not linear — account growth over time.
In simple terms: simple trading earns the same dollar amount every month. Compounding earns more every month because each month's gain is added to the base that generates the next month's gain. A $10,000 account earning 5% generates $500 in month 1. In month 12, that same 5% rate generates $895 — from the exact same percentage return on a larger base. In month 36, it generates $2,758. No additional skill or risk — just the mathematics of reinvestment.
Compounding is not exclusive to forex. It is the same mechanism behind compound interest in savings accounts and dividend reinvestment in stocks. What makes forex different is the speed: a professional trader achieving 5% monthly compounds at a 79.6% annual CAGR — far higher than most asset classes. That potential comes with commensurate volatility risk, which is why drawdown control is the critical companion to any compounding strategy.
- →Forex compounding = reinvesting profits so each trade is sized off a growing balance
- →Simple trading: same dollar gain every month | Compounding: growing dollar gain every month
- →$10,000 at 5%/month earns $500 in month 1 and $2,758 in month 36 — same percentage, bigger base
- →Annual CAGR equivalent of 5% monthly = 79.6%
- →Prerequisite: consistent percentage-based position sizing (1% risk per trade)
How to Use the Forex Compounding Calculator
The compounding calculator on this site projects your account growth month-by-month based on three inputs. Step 1 — Starting Balance: enter your current account balance or the capital you plan to deposit. The calculator works identically for any amount from $100 to $1,000,000. Step 2 — Monthly Return %: enter your realistic average monthly return. Use the geometric mean of all your live-trading months, including losing months. If you are projecting before going live, use a conservative 2–3% for beginner targets. Step 3 — Number of Months: enter your target time horizon. 12, 24, or 36 months are the most useful windows for seeing compounding in action.
What the calculator shows: your projected ending balance, total profit earned, and a month-by-month breakdown of balance and monthly gain. Watch the "Monthly Gain" column — it starts small and grows every single month even though the percentage stays fixed. That growing monthly dollar figure is the compounding effect made visible. At 5% monthly from $10,000, month 1 earns $500 and month 36 earns $2,758 — for exactly the same trading performance.
Key input tip: do not use your best month as your monthly return input. Use the average of all months including the losing ones. If you have 6 months of data: +8%, −3%, +6%, +2%, −1%, +5% — your arithmetic average is 2.83%. Your geometric mean (more accurate for compounding) is slightly lower. Use 2.5–3% as a conservative input for a trader at this performance level. Entering 8% (best month) produces a projection that will dramatically overstate your actual account trajectory.
- →Input 1 — Starting Balance: any amount from $100 to $1,000,000
- →Input 2 — Monthly Return %: use your real average across all months (include losing months)
- →Input 3 — Number of Months: 24–36 months shows compounding most clearly
- →Watch the Monthly Gain column — it grows every month at the same percentage
- →Tip: use geometric mean of returns, not arithmetic average, for accurate projections
- →Conservative inputs produce useful projections; optimistic inputs produce disappointment
Skip the manual math
Model your account growth — see month-by-month compounding projections from your real returns.
Open Compounding Calculator →The Compound Growth Formula
The compound growth formula is: Future Value = Starting Balance × (1 + Monthly Return Rate)^Months. At 5% monthly return starting from $5,000: After 12 months = $5,000 × (1.05)^12 = $8,979. After 24 months = $5,000 × (1.05)^24 = $16,125. After 36 months = $5,000 × (1.05)^36 = $28,937. The growth accelerates over time — earning 5% on $28,937 ($1,447/month) is nearly six times more than 5% on $5,000 ($250/month) — for exactly the same trading performance.
The compounding mechanism works because profits are reinvested into the capital base, and future position sizes are calculated on the growing balance. With 1% risk per trade, a $5,000 account risks $50 per trade. After the account grows to $15,000, the same 1% trade risks $150 — meaning the same winning setup now earns three times as many dollars as it did when the account was smaller. No additional skill, no additional risk, no additional effort.
Compounding is blind to the absolute dollar amount — it only cares about the rate. This is why consistent percentage returns matter far more than the starting balance. A trader who grows a $1,000 account by 5% per month is building identical proportional wealth to a trader growing a $1,000,000 account by the same rate. The starting line is irrelevant to the percentage trajectory. Use the compounding calculator to model any starting balance at any return rate.
- →Formula: Future Value = Starting Balance × (1 + Monthly Rate)^Months
- →$5,000 at 5%/month × 12 months = $8,979
- →$5,000 at 5%/month × 24 months = $16,125
- →$5,000 at 5%/month × 36 months = $28,937
- →Month 36 earns $1,447 in one month — month 1 earned $250 at the same 5%
Simple vs Compound Returns
Simple returns keep the dollar risk fixed regardless of account growth. Compound returns recalculate the dollar risk based on the current balance every trade. Both use the same percentage — the difference is whether that percentage is applied to the original balance or the current balance. Over short periods, the difference is small. Over 24–36 months, it becomes significant.
Example — $10,000 starting balance, 5% monthly return, 24 months. Simple growth (fixed $500/month profit): Month 12 = $16,000. Month 24 = $22,000. Compound growth (5% of current balance each month): Month 12 = $17,959. Month 24 = $32,251. The compounding advantage at 24 months is $10,251 — earned with zero additional trading skill. The only difference is recalculating your position size based on the current balance instead of the original.
In practice, switching from simple to compound position sizing is a single decision: stop using a fixed lot size and start using a fixed percentage of your current account balance for every trade. Most traders using fixed lot sizes (e.g., always 0.1 lots) are unknowingly growing their account linearly. Switching to percentage-based sizing — e.g., always risking 1% of current balance — activates compounding automatically.
- →$10,000 at 5%/month × 12 months — Simple: $16,000 | Compound: $17,959
- →$10,000 at 5%/month × 24 months — Simple: $22,000 | Compound: $32,251
- →$10,000 at 5%/month × 36 months — Simple: $28,000 | Compound: $57,918
- →Compounding advantage at 36 months: $29,918 extra — same trading, same percentage
- →Key switch: fixed lot size = simple growth | % of balance = compound growth
Realistic Monthly Return Benchmarks
The most important step before projecting compound growth is being honest about your achievable monthly return. Most traders overestimate because they anchor on best months rather than average months — the correct input is the arithmetic average of all live-trading months, including months where you lost money. A trader with returns of +8%, −3%, +6%, +2%, −1%, +5% has an average monthly return of 2.83%, not 8%.
Performance benchmarks from published research and verified prop firm data: Beginner (first 1–2 years live): −5% to +3% average monthly, high variance, frequent blowouts. Intermediate (2–4 years, tested edge): 0% to +6% monthly, improving consistency. Advanced (4+ years, institutional discipline): 3–12% monthly, sustained. These are averages — any single month can deviate widely. If you are in your first year projecting 15% monthly in the compound calculator, your projection will dramatically overstate your actual account trajectory.
The benchmark to target is consistency, not magnitude. A trader averaging 4% per month for 36 months ($10,000 → $47,084) will outperform a trader averaging 8% for 18 months then blowing up and restarting. The compound formula punishes inconsistency — a single −30% month at month 18 wipes more than a year of 5% gains. Volatility of returns matters as much as the average return.
- →Beginner (year 1–2): −5% to +3%/month average (include losing months)
- →Intermediate (year 2–4): 0% to +6%/month, lower variance
- →Advanced (4+ years): 3–12%/month, consistent execution
- →Your input: average all live-trading months (not just profitable months)
- →Consistency beats magnitude — steady 4%/month beats volatile 10%/month with drawdowns
The Rule of 72: Account Doubling Time
The Rule of 72 is the fastest mental calculation for estimating account doubling time: divide 72 by your monthly return percentage. At 3% monthly: 72 ÷ 3 = 24 months to double. At 5% monthly: 72 ÷ 5 = 14.4 months. At 6% monthly: 72 ÷ 6 = 12 months. At 8% monthly: 72 ÷ 8 = 9 months. At 12% monthly: 72 ÷ 12 = 6 months. The formula works because 72 is close to the mathematically exact number (ln(2) × 100 = 69.3) — accurate within 1–2 months for returns between 2% and 15%.
After the first doubling, the Rule of 72 applies again — from the doubled balance. A $10,000 account at 5% monthly doubles to $20,000 at month 15, then doubles again to $40,000 at month 30, then doubles again to $80,000 at month 45. Each doubling takes the same 14–15 months because the percentage rate stays constant. This is why the effect of compounding is often called "slow at first, then impossible to ignore."
The Rule of 72 also reveals the cost of a lower return rate. At 6% monthly, the account doubles every 12 months. At 4% monthly, it doubles every 18 months. The 2% difference in monthly return costs 6 months per doubling — and those 6 months cost exponentially more at higher account balances. This is why experienced traders focus obsessively on protecting their return rate rather than maximizing single-trade size.
- →3%/month → doubles every 24 months (Rule of 72: 72 ÷ 3)
- →5%/month → doubles every 14.4 months (72 ÷ 5)
- →6%/month → doubles every 12 months (72 ÷ 6)
- →8%/month → doubles every 9 months (72 ÷ 8)
- →10%/month → doubles every 7.2 months (72 ÷ 10)
- →12%/month → doubles every 6 months (72 ÷ 12)
How Drawdowns Destroy Compound Growth
Compounding requires an uninterrupted growing base. Drawdowns break this by shrinking the base below the previous peak, forcing the account to recover before compounding can resume from a new high. A 20% drawdown on a $20,000 account leaves $16,000. At 5% monthly, recovering back to $20,000 takes 5 months — 5 months of compounding wasted on recovery rather than growth. The compounding curve stalls, then restarts from a lower base.
The math is asymmetric in the wrong direction. Six months of 5% returns from $10,000 builds to $13,401. A single 25% drawdown brings it to $10,051 — nearly back to the start despite 6 months of profitable trading. This is why professional trading frameworks prioritize drawdown limits above all else: a single large drawdown can erase an entire year of compounding progress. The drawdown calculator shows exactly how many months of normal returns are needed to recover from any drawdown size.
The practical protection is consistent percentage-based position sizing (1% risk per trade) combined with a hard daily loss limit (stop trading after losing 2–3% in one session). These two controls cap the worst-case single-day drawdown and prevent the spiral where one bad session destroys multiple months of compounding. With a 3% daily limit, the worst possible day costs 3% of the account — recoverable in weeks, not months.
- →10% drawdown requires 11.1% gain to recover
- →20% drawdown requires 25% gain to recover
- →30% drawdown requires 42.9% gain to recover
- →50% drawdown requires 100% gain to recover
- →Protection: 1% risk per trade + 3% daily loss limit caps worst-case damage
Compounding With Different Starting Balances
The percentage growth is identical at every starting balance — compounding is scale-invariant. The dollar amounts differ, but the proportional trajectory does not. This means a $500 account compounding at 5% monthly builds the same percentage wealth as a $50,000 account at the same rate. The only difference is how long it takes to reach dollar milestones.
Starting balance comparison at 5% monthly return over 36 months: $500 → $2,896. $1,000 → $5,792. $5,000 → $28,960. $10,000 → $57,918. $25,000 → $144,796. The ratio between outcomes is exactly the ratio between starting balances — $25,000 (5× of $5,000) produces exactly 5× the terminal value ($144,796 vs $28,960). This consistency is what makes the percentage rate — not the starting balance — the only variable that matters to optimize.
For traders starting with small accounts ($500–$2,000), the practical implication is that building the skill of consistent percentage returns is worth more than adding capital too early. A trader who proves they can achieve 5% consistently for 12 months on $1,000 will compound $10,000 or $100,000 at the same rate — the skill transfers perfectly. The starting balance only affects the dollar size of early months; it does not affect the long-term compounding trajectory.
- →$500 at 5%/month × 36 months = $2,896
- →$1,000 at 5%/month × 36 months = $5,792
- →$5,000 at 5%/month × 36 months = $28,960
- →$10,000 at 5%/month × 36 months = $57,918
- →$25,000 at 5%/month × 36 months = $144,796
- →Percentage growth is identical at every balance — starting size only affects dollar milestones
36-Month Scenarios: 3%, 5%, and 8% Returns
Scenario A — Conservative, 3% per month from $10,000: Month 6: $11,940. Month 12: $14,258. Month 24: $20,328. Month 36: $28,983. This is achievable by many consistent traders and represents genuine, sustainable growth without extreme risk-taking. At 36 months, the account has nearly tripled from profits alone — no additional deposits required.
Scenario B — Intermediate, 5% per month from $10,000: Month 6: $13,401. Month 12: $17,959. Month 24: $32,251. Month 36: $57,918. The jump from 3% to 5% monthly roughly doubles the terminal value over 36 months. Month 36 generates nearly $2,758 in profit in a single month — from a $10,000 start. This illustrates why even small improvements in average monthly return produce dramatic long-term compounding differences.
Scenario C — Advanced, 8% per month from $10,000: Month 6: $15,869. Month 12: $25,182. Month 24: $63,412. Month 36: $159,682. At 8% monthly, $10,000 grows to nearly $160,000 in three years. Month 36 alone generates $11,836 in profit. However, this return level requires institutional-level discipline, a rigorously tested strategy, and near-perfect drawdown control. Use the compounding calculator with your real average monthly return for an honest projection.
- →$10,000 at 3%/month × 36 months = $28,983 (×2.9)
- →$10,000 at 5%/month × 36 months = $57,918 (×5.8)
- →$10,000 at 8%/month × 36 months = $159,682 (×16.0)
- →Month 36 profit alone at 5%: $2,758 vs month 1 profit: $500
- →A 20% drawdown at month 18 costs ~5 months of compounding progress at 5%/month
- →Always use your real average (including losing months) — not your best month
Compounding With Withdrawals
Full reinvestment maximizes compound growth but delays when you realize real income. Partial reinvestment splits profits between withdrawing income now and growing the base for future income. Most professional traders move toward partial withdrawal once the account reaches a size where a percentage of profits covers meaningful living expenses.
Example — $10,000 account, 5% monthly return ($500/month profit in month 1). Option A (full reinvestment): all $500 stays in the account. Month 36 balance: $57,918. Option B (withdraw $200/month, reinvest $300): Month 36 balance: ~$38,000. Total withdrawn over 36 months: $7,200. Total wealth (account + withdrawals): ~$45,200. Option C (withdraw $400/month, reinvest $100): Month 36 balance: ~$14,200. Total withdrawn: $14,400. Total wealth: ~$28,600. Full reinvestment wins on terminal balance; partial reinvestment wins on cash flow during the compounding period.
The optimal withdrawal strategy depends on your financial situation. If you have income from another source, full reinvestment for 24–36 months produces dramatically better outcomes. If trading is your primary income, withdrawing 30–40% of monthly profits while reinvesting the rest allows the account to still grow meaningfully — just more slowly. What destroys compounding entirely is withdrawing 100% of profits every month, which converts compound growth back into simple linear growth.
- →Full reinvestment: $10,000 → $57,918 at 36 months (5%/month)
- →60% reinvestment ($300/month kept): ~$38,000 at 36 months
- →20% reinvestment ($100/month kept): ~$14,200 at 36 months
- →0% reinvestment (withdraw everything): linear $10,000 + $18,000 = $28,000 at 36 months
- →Optimal: full reinvestment for 24–36 months, then move to partial withdrawal
Geometric Mean vs Arithmetic Mean
Most traders calculate their average monthly return by adding all monthly returns and dividing by the number of months — this is the arithmetic mean. The compound growth formula does not use the arithmetic mean. It uses the geometric mean, which accounts for the compounding effect of gains and losses on each other. The difference is significant and almost always means your compound calculator is overstating your projected growth.
Concrete example: Month 1 = +50%, Month 2 = −50%. Arithmetic mean = (50 + (−50)) ÷ 2 = 0%. If you enter 0% into a compound calculator, it projects no growth and no loss. But the actual account: $10,000 × 1.50 = $15,000 after month 1. $15,000 × 0.50 = $7,500 after month 2. The account is down $2,500 despite a 0% arithmetic average. The geometric mean = √(1.50 × 0.50) − 1 = √0.75 − 1 = −13.4%. That is the number that correctly predicts compound growth.
For accurate compound projections, calculate your geometric mean return: multiply all monthly return factors (1 + return as decimal) together, take the Nth root (where N = number of months), then subtract 1. Example: returns of +5%, −3%, +8%, +2%: factors = 1.05 × 0.97 × 1.08 × 1.02 = 1.1239. Fourth root = 1.1239^(1/4) = 1.0298. Geometric mean = 2.98%/month. Enter 2.98% into the compound calculator — not the 3% arithmetic average — for an accurate projection. The difference grows larger as return volatility increases.
- →Arithmetic mean: (sum of returns) ÷ months — overstates compound growth
- →Geometric mean: (product of return factors)^(1/N) − 1 — accurate for compound projections
- →+50% then −50% = 0% arithmetic mean but −13.4% geometric mean (actual loss)
- →Higher return volatility = larger gap between arithmetic and geometric mean
- →Always use geometric mean as your compound calculator input for accurate results
Per-Trade vs Monthly Compounding
The compound growth formula assumes returns are applied continuously to the growing balance. In trading, this raises a practical question: when exactly do you recalculate your position size — before every trade (per-trade compounding) or once per month (monthly compounding)?
Per-trade compounding recalculates the position size before every single trade using the current account balance. If the balance is $10,247 after three trades, the next position is sized as 1% of $10,247 = $102.47 risk. This is mathematically the most accurate implementation of compounding and produces slightly higher terminal values over long periods. It is the standard for algorithmic traders and prop firm traders where position sizes are computed automatically.
Monthly compounding updates the position size once at the start of each month using the previous month's closing balance. All trades in January use the December 31st balance for sizing. This is simpler to manage manually and produces results within 0.5–2% of per-trade compounding for traders risking 1–2% per trade. For traders taking fewer than 20 trades per month, monthly compounding is the practical choice. The position size calculator supports both approaches — use it before every trade (per-trade) or once at month start (monthly) depending on your preference.
- →Per-trade: recalculate position size before every trade using current balance — most accurate
- →Monthly: update position size once at month start — practical for manual traders
- →Difference at 1% risk/trade: <1% total variance over 36 months
- →Difference at 5% risk/trade: up to 8% total variance over 36 months
- →Algorithmic/prop firm traders: per-trade. Manual retail traders: monthly is fine
What Actually Stops Compounding in Practice
Most traders who understand compounding mathematically still fail to compound in practice. The gap between calculator projections and actual account growth comes from three sources: behavioral failures, forex-specific costs, and return inconsistency. Understanding these gaps is as important as understanding the formula.
Behavioral failures that break compounding: (1) Over-risking after wins — "I am playing with house money, I can risk more." The house money fallacy is mathematically false; every dollar in the account earns the same compound return regardless of how it got there. (2) Panic withdrawals during drawdowns — pulling money out at the worst point locks in losses and removes the base needed to recover and resume compounding. (3) Impatience in months 1–12 — compounding is slow at the start. A $5,000 account at 5% earns $250 in month 1. This feels insignificant compared to the projections for month 36. Traders often abandon the system before the acceleration phase begins.
Forex-specific hidden costs: swap (rollover) fees on positions held overnight reduce realized returns below gross trading returns. On a standard EUR/USD lot, swap costs run −$3 to −$8 per night depending on the broker and rate differential. A trader holding positions overnight 15 days per month pays $45–$120 in swap per lot — real money that reduces the effective monthly return before the compound calculator even starts. Factor swap costs into your realistic return estimate when projecting compound growth over 24–36 months. The swap calculator shows exact overnight costs per position.
- →Over-risking after wins destroys position sizing discipline — every dollar compounds equally
- →Panic withdrawals during drawdowns remove the base needed for recovery
- →Impatience in months 1–12 causes abandonment before the acceleration phase
- →Swap fees on forex positions: $45–$120/lot/month depending on broker and pair
- →Realistic compound rate = gross trading return − swap costs − spread drag
- →Track geometric mean return monthly — your actual compound input, not your best month
CAGR: Monthly Return to Annual Rate
CAGR (Compound Annual Growth Rate) is the standard way to express annual compound returns and is useful for comparing your forex trading performance to benchmarks like the S&P 500 (~10% CAGR historically) or professional hedge funds (~15–25% CAGR). Convert your monthly return to CAGR using: CAGR = (1 + Monthly Rate)^12 − 1.
CAGR by monthly return: 1%/month = 12.7% annual CAGR. 2%/month = 26.8% CAGR. 3%/month = 42.6% CAGR. 4%/month = 60.1% CAGR. 5%/month = 79.6% CAGR. 8%/month = 151.8% CAGR. Even a modest 3% monthly return produces a 42.6% annual CAGR — far above any conventional investment class. This is why forex compounding is mathematically compelling and why protecting that monthly rate from drawdowns and hidden costs is the central discipline of serious trading.
To convert CAGR back to monthly rate: Monthly Rate = (1 + CAGR)^(1/12) − 1. A 50% annual CAGR = (1.50)^(1/12) − 1 = 3.44%/month. Use the CAGR calculator to convert between monthly returns and annual rates instantly — and to compare your compounding rate against benchmarks without doing the exponent math manually.
- →1%/month = 12.7% annual CAGR
- →2%/month = 26.8% CAGR
- →3%/month = 42.6% CAGR
- →5%/month = 79.6% CAGR
- →8%/month = 151.8% CAGR
- →S&P 500 benchmark: ~10% annual CAGR = 0.80%/month
- →Convert monthly → annual: CAGR = (1 + Monthly Rate)^12 − 1
Compounding Through Position Sizing
Compounding does not happen automatically in trading — it requires the deliberate decision to recalculate your position size based on the current, growing account balance rather than the original starting balance. This is what reinvesting profits means in practice for a trader: the next trade's position size calculation uses the current balance, producing a larger dollar risk (and therefore a larger potential reward) than the same calculation on the original starting balance.
The alternative — keeping dollar risk constant (e.g., always risking $100 regardless of balance) — is simple growth and produces linear, not exponential results. Fixed dollar risk on a $10,000 account that grows to $30,000 still risks $100 per trade — the same as month one. Percentage-based position sizing automatically adjusts: 1% of $30,000 risks $300, and winning trades earn $600 at 2:1 R:R instead of $200. No extra decisions required — the formula does the work every time.
This is the complete picture of why position sizing is the most important technical skill in trading: it determines not just whether individual trades are correctly sized, but whether your account grows exponentially or linearly over time. Master percentage-based sizing from your first trade, and compounding activates automatically. The position size calculator makes this calculation instant for any account balance, stop loss, and risk percentage.
Compounding on a Prop Firm or Funded Account
Prop firm trading changes the compounding picture significantly. On a funded account, you do not own the capital — meaning you cannot directly reinvest profits into the account balance. However, compounding still applies in two important ways: payout compounding and account scaling.
Payout compounding: as your funded account grows through consistent profits, your payout amount grows proportionally even if the profit split stays fixed. A $50,000 funded account earning 5% monthly generates $2,500 in profit. At an 80% payout, you receive $2,000. If the prop firm scales you to $100,000 for consistent performance, the same 5% earns $5,000 in profit and a $4,000 payout — double the income for identical trading. The compounding effect applies to your income stream, even without owning the balance.
Account scaling: most prop firms offer scaling programs where consistent profitability unlocks larger funded accounts. This is the prop firm version of compounding — instead of the account balance growing, the account size steps up through milestones. Passing a $25,000 challenge and trading profitably for 3–6 months may unlock a $50,000 or $100,000 allocation. Each scaling step multiplies your monthly payout by the same ratio. Use the prop firm challenge calculator to estimate your probability of passing a challenge at your historical win rate, and the prop firm position size calculator to size correctly within drawdown limits while maximizing compounding potential.
- →Prop firm compounding = payout grows proportionally as funded account grows
- →$50k account at 5%/month, 80% payout → $2,000/month payout
- →$100k account at 5%/month, 80% payout → $4,000/month payout
- →Scaling programs multiply payout without increasing personal risk capital
- →Key: pass the challenge, stay within drawdown limits, trade consistently
- →Use the prop firm position size calculator to size within drawdown rules
How to Forex Compounding Guide — Step by Step
- 1
Set starting balance
Enter your current account balance or the capital you plan to start with. Compounding works identically at any account size — $500 and $50,000 grow at the same percentage rate.
- 2
Enter your monthly return target
Use your actual tracked average return — including losing months. Do not use your best month. Professional range: 3–8% per month consistently. Calculate this by adding all monthly returns (positive and negative) and dividing by the number of months.
- 3
Set number of months
Input your target time horizon. Compounding shows dramatic results over 12–36 months. The effect accelerates — growth in month 36 is far larger in dollar terms than growth in month 1 at the same percentage.
- 4
Read the month-by-month table
The calculator shows your projected balance each month. Note how the dollar gain per month increases over time even though the percentage stays fixed — this is the compounding effect in action.
- 5
Adjust for withdrawals
If you plan to withdraw profits, enter your monthly withdrawal amount. The calculator shows how partial withdrawals slow but do not stop compound growth — you can still compound the remaining balance.
Frequently Asked Questions
Q.What is compounding in forex trading?
Compounding in forex means reinvesting profits back into your account and applying the same percentage risk to the growing balance. As the account grows, the dollar amount risked and won per trade increases proportionally — creating exponential rather than linear account growth over time. A 5% monthly gain on $10,000 earns $500. The same 5% on $20,000 earns $1,000 — twice as much for identical trading performance.
Q.What is a realistic monthly return in forex?
Consistently profitable retail traders achieve 3–8% per month. Top professional traders may average 5–15% monthly. Returns above 20% per month are unsustainable long-term and usually involve excessive risk. Always use your actual average return across at least 6 months of live trading for projections — not your best month. Include losing months in the average.
Q.Does compounding work with small accounts?
Yes — the compounding percentage is identical regardless of account size. $500 at 5% per month for 24 months reaches $1,613. $10,000 at the same rate reaches $32,250. The percentage growth is equal; only the dollar amounts differ. Small accounts benefit from compounding just as much as large ones — the mathematical engine is the same.
Q.How does drawdown destroy compounding?
A 20% drawdown on a $10,000 account leaves $8,000 — and then requires a 25% gain just to return to $10,000. During that recovery period, the compounding base is smaller, slowing subsequent growth. Six months of 5% returns from $10,000 reaches $13,401. A 25% drawdown brings it to $10,051 — nearly erasing all progress. This is why protecting the compounding base from large drawdowns is the single most important factor in long-term account growth.
Q.What is the difference between simple and compound returns in trading?
Simple returns use the same fixed dollar risk every trade regardless of account growth. Compound returns recalculate risk based on the current balance each trade. At 5% monthly: simple on $10,000 earns $500/month forever. Compound earns $500 in month 1, $525 in month 2, $551 in month 3 — growing every month. After 24 months: simple gives $22,000 total; compound gives $32,250 total. The $10,250 difference is earned with zero extra skill — just consistent percentage-based position sizing.
Q.Should I withdraw profits or keep reinvesting them?
The compounding argument favors reinvesting — every dollar withdrawn reduces the base that generates future gains. However, withdrawing a portion once the account reaches a target lets you realize real wealth while still compounding the rest. Many professional traders use a split: reinvest 70–80% of profits monthly, withdraw 20–30% once the account reaches sustainable size (typically when 1% risk per trade covers monthly living expenses).
Q.How many months does it take to double a $10,000 trading account?
At 3% monthly: 24 months. At 5% monthly: 15 months. At 8% monthly: 9 months. At 10% monthly: 8 months. Use the Rule of 72 for a quick estimate: divide 72 by your monthly return percentage. At 3%: 72 ÷ 3 = 24 months. At 6%: 72 ÷ 6 = 12 months. These projections assume consistent returns with no significant drawdowns.
Q.What is the Rule of 72 in trading?
The Rule of 72 is a quick mental formula to estimate how long it takes to double your account: divide 72 by your monthly return percentage. At 3%/month: 72 ÷ 3 = 24 months to double. At 5%/month: 72 ÷ 5 = 14.4 months. At 8%/month: 72 ÷ 8 = 9 months. At 10%/month: 72 ÷ 10 = 7.2 months. The Rule of 72 works because 72 is close to ln(2) × 100 = 69.3 — the mathematically exact number. The shortcut is accurate within 1–2 months for returns between 2% and 15%.
Q.How does compounding work differently on a prop firm account?
On a funded prop firm account, you cannot truly compound in the traditional sense because you do not own the capital. However, you compound your payout. As your account grows through consistent profits, your payout amount grows proportionally — $50,000 account at 5% monthly = $2,500 profit, 80% payout = $2,000. After scaling to $100,000: same 5% = $5,000 profit, $4,000 payout. The compounding effect applies to your income stream even without owning the account.
Q.How do I calculate compound growth manually?
Use the formula: Future Value = Starting Balance × (1 + Monthly Return Rate)^Number of Months. Example: $5,000 starting balance, 5% monthly return, 12 months: Future Value = $5,000 × (1.05)^12 = $5,000 × 1.7959 = $8,979. For 24 months: $5,000 × (1.05)^24 = $5,000 × 3.2251 = $16,125. The exponent (power) is what creates exponential rather than linear growth.
Q.Should I recalculate position size every trade or every month?
Both approaches work — the right choice depends on your trading frequency. Per-trade compounding: recalculate position size before every trade using current balance. This is mathematically optimal and is what the compound formula assumes. Monthly compounding: update position size once at the start of each month using the month-end balance. Easier to manage, nearly as effective for traders making fewer than 20 trades/month. The difference between the two is minimal at 1–2% risk per trade but increases with higher risk percentages. Most retail traders use monthly compounding for simplicity; active traders and prop firm traders use per-trade.
Q.Why does my actual account growth differ from the compounding calculator?
Three reasons cause the gap: (1) Arithmetic vs geometric mean — if you input your arithmetic average return (sum of monthly returns ÷ months), the calculator overstates growth. A +50% month followed by a −50% month = 0% arithmetic average but −25% geometric mean (actual account is down 25%). Use the geometric mean for accurate projections. (2) Swap and spread costs — overnight positions in forex accrue swap fees that reduce net returns. (3) Execution variance — slippage, partial fills, and missed trades reduce realized returns below planned returns. The calculator shows best-case compounding; real accounts typically compound at 70–85% of the projected rate.
Q.What is CAGR and how does it relate to forex compounding?
CAGR (Compound Annual Growth Rate) is the annual version of the monthly compound rate — it measures how much your account grew per year on a compound basis. Convert monthly return to CAGR using: CAGR = (1 + Monthly Rate)^12 − 1. At 3%/month: CAGR = (1.03)^12 − 1 = 42.6% per year. At 5%/month: CAGR = (1.05)^12 − 1 = 79.6% per year. At 8%/month: CAGR = (1.08)^12 − 1 = 151.8% per year. CAGR is useful for comparing forex trading returns to other investments (stocks average ~10% CAGR annually). Use the [CAGR calculator](/calculators/cagr-calculator) to convert between monthly returns and annual rates.
Q.Is 5% monthly return realistic in forex trading?
5% per month is achievable for experienced traders with a tested strategy, but it is not typical for beginners. Industry data from verified prop firm accounts suggests that consistent traders average 3–8% monthly over sustained periods (12+ months). 5% monthly translates to a 79.6% annual CAGR — far above conventional investments, which is why it requires professional-level risk management to sustain. Key: 5% average means some months will be 8–10% and some will be flat or negative. The average must be maintained across all months including losing ones. Entering 5% into a compound calculator is reasonable for an intermediate trader with 12+ months of consistent live trading history. For beginners, 2–3% is a more honest projection target.
Q.Can I compound daily in forex trading?
You can compound on a per-trade basis, which in an active strategy effectively means daily compounding. However, daily compounding in the strict sense — earning a fixed percentage every single trading day — assumes unrealistically consistent returns. The compound calculator uses monthly periods because months smooth out the daily variance of real trading. If you take 1 trade per day at 1% risk and win 60% of trades at 1:1 R:R, your effective daily return is about 0.2% — which compounds to roughly 4.4% monthly. The math works on any timeframe; the challenge is maintaining consistent returns day-over-day. Use monthly periods in your projections and let the per-trade position sizing handle the actual compounding frequency.
Q.How do I double my forex account through compounding?
Use the Rule of 72: divide 72 by your monthly return percentage to get the months needed to double. At 3%/month: 72 ÷ 3 = 24 months. At 5%/month: 72 ÷ 5 = approximately 14–15 months. At 8%/month: 72 ÷ 8 = 9 months. The practical steps: (1) Calculate your realistic average monthly return from at least 6 months of live trading. (2) Use percentage-based position sizing on every trade — 1% risk per trade calculated from the current balance. (3) Reinvest 100% of profits — do not withdraw during the compounding period. (4) Protect the base from large drawdowns — a 30% drawdown near your doubling date pushes the timeline back by 7–8 months at 5%/month. The [compounding calculator](/calculators/compounding-calculator) shows the exact month your account reaches 2× the starting balance for any return rate.
Ready to calculate?
Model your account growth — see month-by-month compounding projections from your real returns.
Open Compounding Calculator →
Written by
Foysal MostafaForex trader and software developer. Built TradeCalc to replace the manual spreadsheets I used for position sizing and risk management in my own trading.